THIS ARTICLE/PRESS RELEASE IS PAID FOR AND PRESENTED BY NILU - Norwegian Institute for Air Research - read more
Ice cores reveal how much we have polluted since the Industrial Revolution
Using data from ice cores, senior scientist Sabine Eckhardt has suggested a correction for global black carbon emission from 1850 - 2000. This could make the climate models scientists use more accurate.
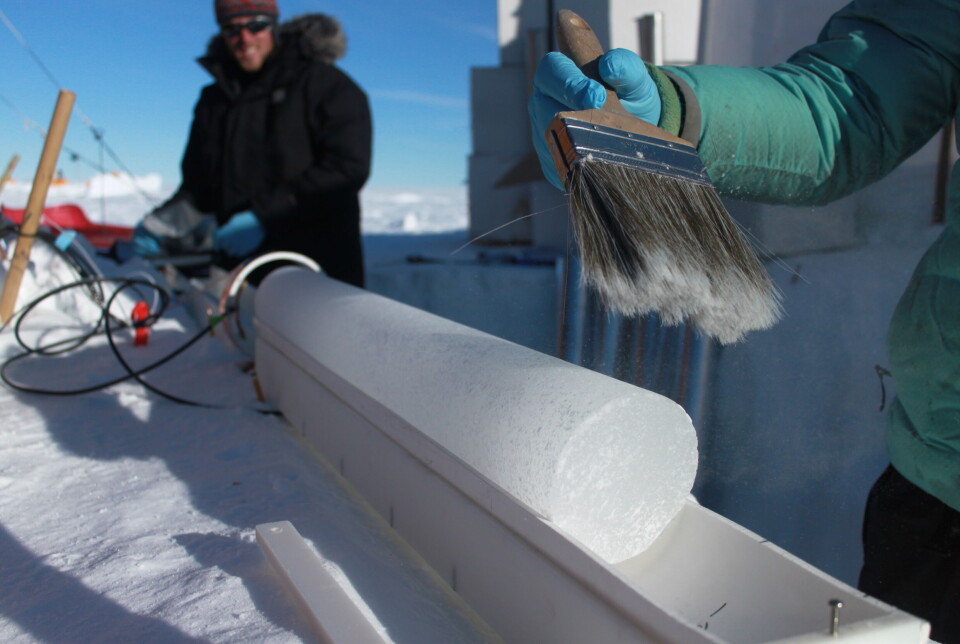
Glaciers consist of layer upon layer of snow and ice, accumulated over thousands of years. These layers are like the annual rings on a tree, capturing various substances within them.
Among these substances is black carbon. Black carbon particles contribute to the warming of the atmosphere. As the black carbon settles on ice and snow, it darkens the surface and thus changes its reflective properties.
Senior scientist Sabine Eckhardt at the Norwegian Institute for Air Research (NILU) works mainly with atmospheric transport modelling.
This means that she uses – and helps develop – advanced mathematical models that calculate how gases, particles and other substances are transported through the atmosphere.
You may have seen her work before. She modeled how the methane from the North Stream site had traveled through the atmosphere from the emission site and all the way to Svalbard.
Time travel by ice cores
Eckhardt is also very interested in ice cores and has contributed to several earlier studies.
One about how events like the Black Death plague impacted the economy of Medieval Europe, and another linking an increase in black carbon in Antarctic ice cores to fires on New Zealand more than 700 years ago.
“Ice cores are like time traveling to the past,” she says. “Like observatories, they provide direct records of atmospherically deposited components such as black carbon.”
Black carbon are tiny soot particles. Its main natural source are wildfires, among the main anthropogenic sources are wood burning and incomplete combustion of fossil fuels.
At high concentrations, it can be damaging to your health because the particles are small enough to breathe in.
Black carbon emissions and human activity
Emissions of black carbon are linked to human activity. When the economy thrives, emissions generally rise due to higher consumption, burning of fossil fuels, etc.
When times are bad, emissions go down.
Additionally, black carbon is among the most important climate forcers. That is, gases and particles that contribute to heating or cooling.
Thus, black carbon is one of the factors in the model runs the UN Climate Panel (IPCC) does to assess climate change.
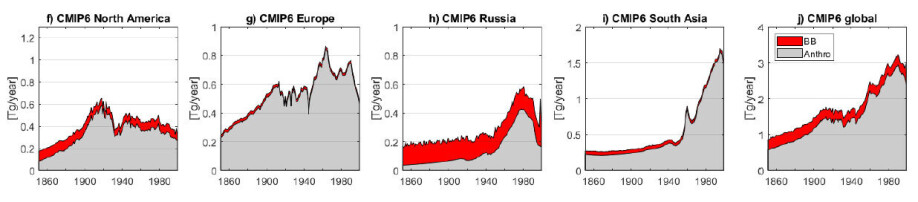
The figure above shows black carbon emissions in different Northern regions based on CMIP6.
CMIP stands for Coupled Model Intercomparison Project, a global initiative comparing climate models. CMIP6 is the name of the newest comparison from 2020. The IPCC uses it in their most recent assessments.
According to these, the anthropogenic emissions in North America peak around 1910. Emissions in Central, East and South Asia peak much later, around 1990. Anthropogenic emissions refer to emissions created by human activity.
In Europe, the first peak is also around 1910, then another in the 1970s. Following that, policy initiatives to improve air quality made the emissions go down.
What happens when observations do not fit with model results?
When Eckhardt first got the ice core data five years ago, in 2017, she wanted to investigate what one could learn by combining ice core observation with transport modelling.
She got the ice core data from international research colleagues who work with retrieving ice cores from the ice and later analyse them.
“Suddenly, I noticed that the black carbon observations from the ice cores did not fit with my model results based on CMIP6. It was frustrating,” Eckhardt says.
But it also made her think.
The emissions were transported by winds many, many years ago and deposited at the ice core locations. Information about the emissions is thus captured in the ice.
“Our former colleague Andreas Stohl suggested that the large array of 13 different ice core data could be used to improve our understanding of past emission,” she says.
At the same time, it could expand our knowledge about the relevance of black carbon for climate change since the Industrial Revolution.
First time using so many ice cores
This idea led to a study recently published in Nature Communicatons.
It presents how Eckhardt and her colleagues used black carbon emission data from ice cores to improve existing emission inventories used in climate modelling.
An emission inventory can be explained as a map of emission strengths and its variation over time. It shows where, when, and how much of something was emitted.
Inventories are among the input parameters for the models climate scientists use to calculate how the concentration of various substances in the atmosphere has changed and impacted the Earth’s climate throughout history.
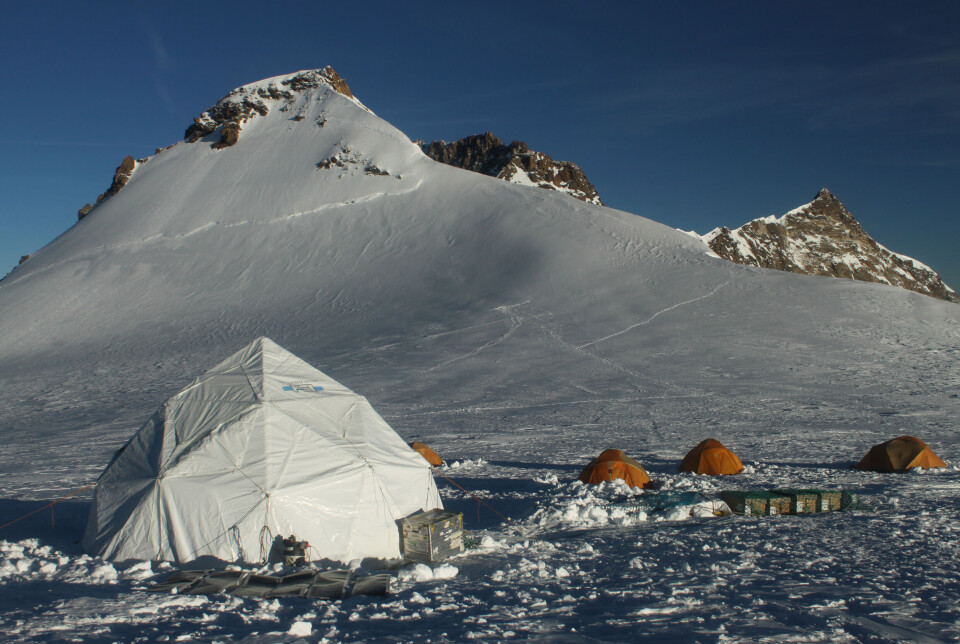
In all, they used annual resolution data spanning the years 1850-2000 from 13 different ice cores.
The cores were drilled at locations in Greenland, Arctic Canada, Svalbard, Russia, the European Alps, and Caucasus. It is the first time someone has used such a large array of ice cores to quantify black carbon emissions.
For each of the ice core locations, Eckhardt and her colleagues could model the atmospheric transport and calculate the black carbon originating from different geographical areas.
Revising history through ice cores
The figure below shows the history of black carbon emissions obtained from ice core data and so-called inversion modeling. In modelling, scientists usually start with a known emission, and calculate what the concentration of the substance in the atmosphere will be.
In inversion modelling, they already know the concentration of the substance in the atmosphere and calculate back to an improved estimate of what the emission was.
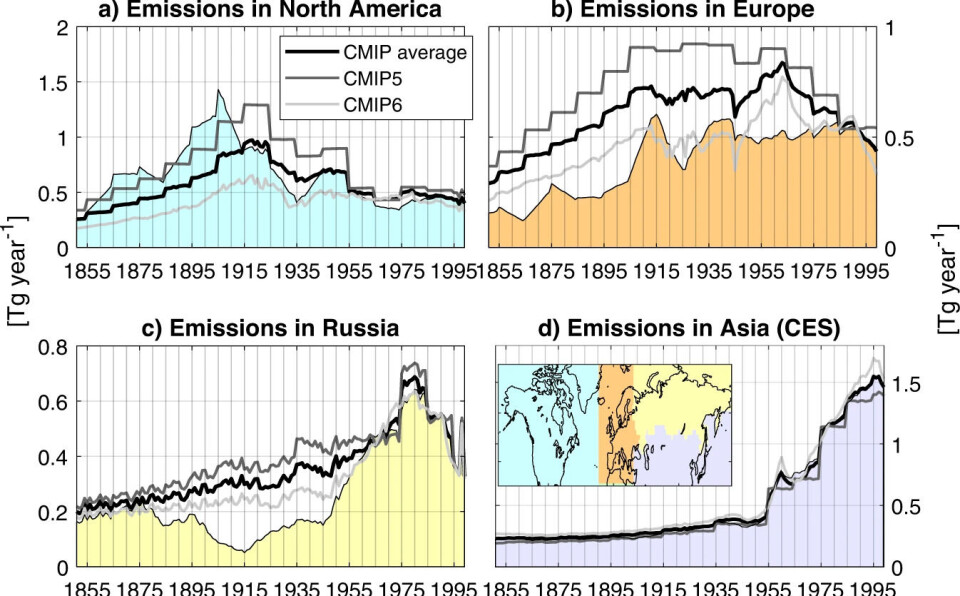
The coloured parts show the new emission overviews after the scientists had performed the inversion:
- Emissions in North America peaked earlier and higher, followed by a deep drop of emissions during the Great Depression in 1929–1939.
- In Russia, the black carbon emissions came to a minimum around the time of the October Revolution in 1917, which may have had a higher impact than earlier assumed.
- The emissions in Europe are overall lower, but the CMIP6 fits quite well.
During the work, Eckhardt received input from scientists from different countries, among them Finland, Switzerland, South Korea, USA and Canada.
“Everyone was happy to contribute their ice core data and pleased that they were used in a bigger context. Having such a supportive international group to collaborate with was both important and rewarding,” says Eckhardt.
On scientific uncertainty
Sabine Eckhardt and her colleague at NILU, senior scientist Ignacio Pisso, state that they would be very happy if their study could help to improve the emission inventories modelers work with.
They’ve put a lot of emphasis on details and uncertainties while working on this.
“It is important to understand that as scientists, we work with probabilities. We need to pay attention to the margin of error,” Pisso says.
He says that in general, people are not used to dealing with probabilities. This often makes communicating scientific uncertainty a difficult task.
Uncertainty in science is often interpreted as absence of knowledge. What it is meant to define, is how well something is known. In general, scientific uncertainty means that there is a range of possible values, and the true value lies somewhere within this range.
Further research may reduce the level of uncertainty – or widen the scope of possibilities.
For now, the two are content with having developed a method that other scientists are already showing an interest in using for other ice core components.
References:
Eckhardt et.al. Revised historical Northern Hemisphere black carbon emissions based on inverse modeling of ice core records, Nature Communications, vol. 14, 2023. DOI: 10.1038/s41467-022-35660-0
McConnell et al., 'Hemispheric black carbon increase after the 13th-century Māori arrival in New Zealand', Nature, 2021. DOI: 10.1038/s41586-021-03858-9 Abstract.
McConnell et al., Lead pollution recorded in Greenland ice indicates European emissions tracked plagues, wars, and imperial expansion during antiquity, PNAS, vol. 115, 2018. DOI: 10.1073/pnas.1721818115
Read the Norwegian version of this article on forskning.no

This article/press release is paid for and presented by NILU - Norwegian Institute for Air Research - read more
This content is created by NILU's communication staff, who use this platform to communicate science and share results from research with the public. NILU is one of more than 80 owners of ScienceNorway.no. Read more here.
See more content from NILU:
-
Summer in Central Europe: Drought and wildfires to be expected
-
How do you design a healthier place to live?“I would prioritise easy, car-free access to everything you need in your daily life"
-
Fires in tropical forests affect more than just the forests
-
Engineer Sam Celentano found 222 grams of gold in a laboratory. What was it doing there?
-
Air pollution levels are still too high across Europe
-
Researchers have discovered how biological particles affect the clouds over the Arctic


