THIS ARTICLE/PRESS RELEASE IS PAID FOR AND PRESENTED BY NILU - Norwegian Institute for Air Research - read more
Can we avoid conflict between farming and biodiversity?
Data on 50 different agricultural products in around 200 countries has given scientists an overview of what kind of biodiversity footprint different foods have.
Our modern lifestyle causes alarming damage to the atmosphere and water supplies.
Farming is one of the leading drivers of biodiversity loss, and the reason why governments, industry, and farmers are working to promote sustainable agriculture.
To accomplish this, they need quantitative information about the kind of impact or ‘footprint’ different types of crops, agricultural areas, and farming practices have on biological diversity.
Protecting diversity while preserving food security
Researchers in Norway, the Netherlands, and Japan have been working to fill in this missing information.
As a basis, they have used records of global supply chains, agricultural production data, and new ecological models. The latter estimate the conservation value of different areas.
The carbon, land, and water footprints of the agriculture industry are already known. But because it has been difficult to determine how much damage agriculture does to biodiversity, that factor has often been omitted when calculating the total biodiversity footprint for an agricultural commodity.
The results from the new study will be helpful when governments design policies that will both protect biodiversity and preserve global food security.
“Food production remains the main cause of biodiversity loss,” Keiichiro Kanemoto says.
He is an associate professor at the Research Institute for Humanity and Nature (RIHN) in Japan, and is one of the authors of the study.
“However, there is a painful lack of systematic data on which products and which countries contribute the most to this loss. Our research spatially overlaps agricultural land and species habitats to identify which crops cause the most pressure,” he says.
The results have been made publicly available on Google Earth Engine, a cloud computing platform used for environmental analyses.
Where food is grown matters
In the study, the researchers divided areas for agriculture into four tiers of conservation priority, from lowest to highest. Then, they looked for the correlation between each agricultural commodity and their production on land of different priority levels.
They found that about a third of all farming occurs in areas deemed as highest conservation priority.
Some staple commodities, such as beef, rice, and soybeans, tend to be produced in high conservation priority areas. Other important commodities, such as barley and wheat, are predominantly sourced from lower risk areas.
The study further shows the effects of international trade. Coffee and cocoa are primarily grown in high conservation priority areas in nations that lie on the equator, but are largely consumed in richer nations like the United States and members of the European Union.
At the global level, its high demand for multiple commodities makes China the biggest influencer of food production in high priority conservation areas.
“A surprising takeaway for me was how much the impact of the same crop can vary based on where it is sourced from,” Daniel Moran says.
He is a senior scientist at the Climate and Environmental Research Institute NILU, and contributed to the study.
He points to beef and soybeans which are grown in high conservation priority areas in Brazil but not in North America. Similarly, wheat is grown in lower conservation priority areas in Eastern Europe than in Western Europe.
Different nations can have significantly different biodiversity food footprints. The United States, EU, China, and Japan all depend heavily on imports to satisfy their demand for beef and dairy.
In Japan, more than 25 per cent of the beef and dairy consumed comes from high conservation priority areas. For the other regions, that number is closer to just 10 per cent.
“That suggests there are opportunities to change the biodiversity footprint of food consumption by simply changing our sourcing of food products” Kanemoto says.
Can climate change lead to future conflicts?
The changing climate is expected to alter both cropping patterns and available habitants.
The researchers evaluated several scenarios to see whether the spatial conflict between wild biodiversity and farming is likely to increase or decrease under predicted 2070 temperatures.
As a response to climate change, species are likely to colonise new territories. This could result in the emergence of new high conservation priority areas or mitigate conflicts in current conservation hotspots.
The researchers are quick to point out that the results do not estimate actual conflict between agriculture and biodiversity. Instead, they show only potential conflict that could arise when agriculture and conservation priority co-exist within the bounds of each 60km2 grid cell used in the study.
“Our spatial approach is a valuable complementary method with other standard techniques to evaluate the impact agriculture has on biodiversity. The knowledge gained from our study should help reduce the trade-off many nations associate with agriculture production and environmental protection,” Kanemoto says.
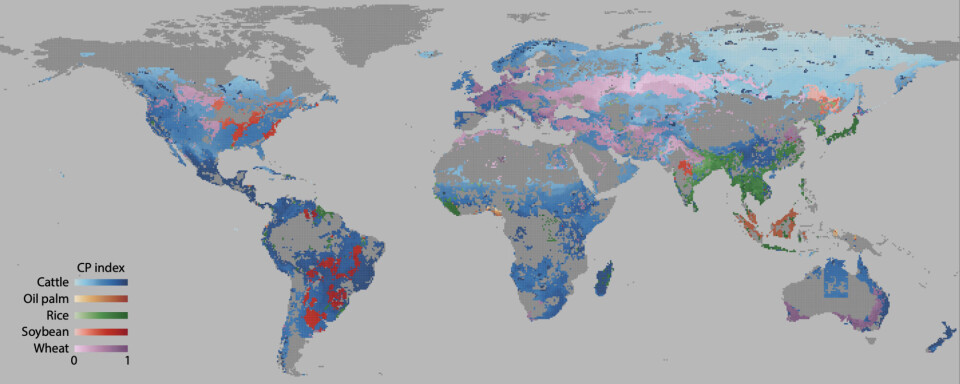
The results can be viewed in an interactive map here, as shown in the picture above.
Reference:
Hoang et al. Mapping potential conflicts between global agriculture and terrestrial conservation, Proceedings of the National Academies of Science, vol. 120, 2023. DOI: 10.1073/pnas.2208376120

This article/press release is paid for and presented by NILU - Norwegian Institute for Air Research - read more
This content is created by NILU's communication staff, who use this platform to communicate science and share results from research with the public. NILU is one of more than 80 owners of ScienceNorway.no. Read more here.
See more content from NILU:
-
Summer in Central Europe: Drought and wildfires to be expected
-
How do you design a healthier place to live?“I would prioritise easy, car-free access to everything you need in your daily life"
-
Fires in tropical forests affect more than just the forests
-
Engineer Sam Celentano found 222 grams of gold in a laboratory. What was it doing there?
-
Air pollution levels are still too high across Europe
-
Researchers have discovered how biological particles affect the clouds over the Arctic


