An article from Norwegian SciTech News at NTNU

Calculating the environmental footprint of governments
If you want to be a good global citizen, there are many tools that you can use to understand just how big your footprint is. But the impact of governmental policies on the environment is an infinitely more difficult calculation to make.
Denne artikkelen er over ti år gammel og kan inneholde utdatert informasjon.
From new cars to email messages, from bananas to home-grown tomatoes: everything we buy, produce or consume has an environmental cost that has come to be called a “footprint”. If you want to be a good global citizen, the Internet offers a range of tools that you can use to understand just how big your footprint is – or what your existing lifestyle is doing to the planet.
But what if you are a government decision maker and want to know the impact of different policies on the environment? That’s an infinitely more difficult calculation to make.
Now, as global policymakers meet in Brazil at the UN’s Rio+20 Conference on Sustainable Development, a group of European researchers has developed a new online “virtual crystal ball” that can help planners envision a greener future and help them get there.
Easy to understand graphics
The online tool is called EUREAPA (for EU Resource and Energy Analysis Programme Application), and has been produced by a coalition of European researchers, including researchers from the Norwegian University of Science and Technology (NTNU) in Trondheim.

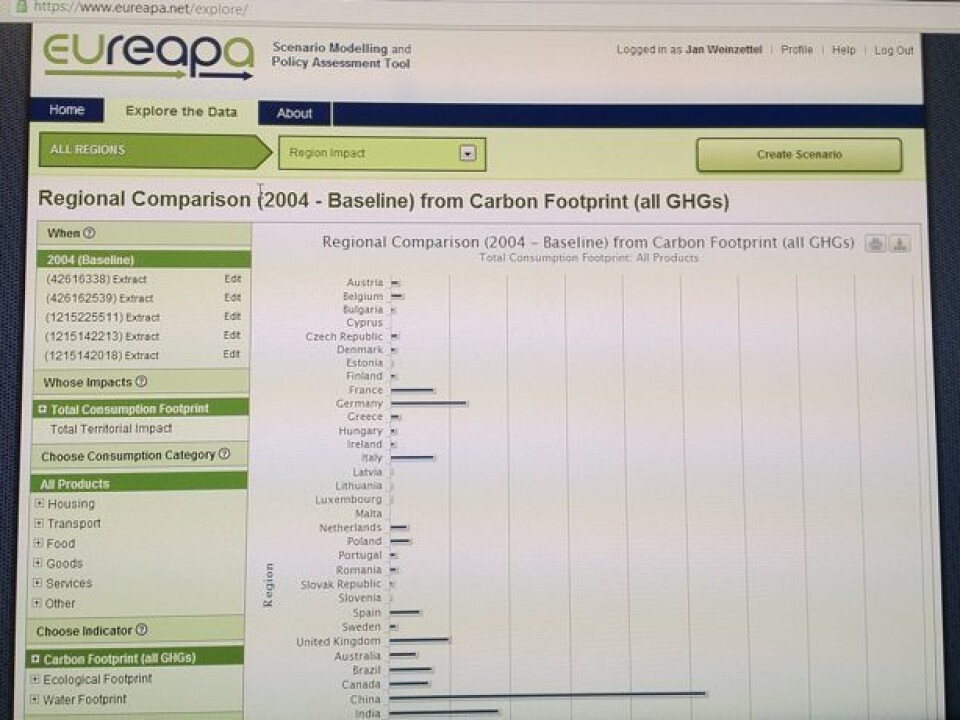
The EUREAPA tool can produce graphics that show how national consumption patterns affect land and water use, along with the production of greenhouse gases.
These three options – called the carbon footprint, the ecological footprint and the water footprint –give policy makers a chance to look at environmental pressures from three different perspectives so they can avoid shifting environmental impacts from one class to another.
"Using the footprint perspective can also help policy makers avoid shifting environmental problems from one region to another – for example, by moving production sites into regions with less stringent environmental regulations," says Jan Weinzettel, a postdoctoral researcher at NTNU who has been involved in the tool development during the last two years.
"While moving production sites to other parts of the globe clearly improves a country’s own environment, it merely moves the actual impact of production somewhere else, so there is no real gain."
A crystal ball

But perhaps EUREAPA’s biggest strength is that it can analyse future development scenarios. The user can enter different values into a range of fields, from population numbers to consumption patterns and expected economic growth, and the tool can calculate a future scenario that shows how the values entered will affect the three different footprints.
"This allows policymakers to investigate how different possible government policies would change future environmental pressures," Weinzettel says.
"The EUREAPA tool helps you analyse the effects that might be promoted by different policies,” he explains. “What would be the combined results of several policy changes?”
Looking for unintended results
"Consider this goal: a country tries to eliminate the carbon dioxide emissions from its electricity supply. Given the worrisome trends with greenhouse gas emissions and the warming of the planet, cutting the emissions of the biggest greenhouse gas, carbon dioxide, seems like a good ideam", says the researcher.
But Weinzettel points out that this one big change might have unexpected, and unwanted results. It could force other changes in land and water use that might in fact cause higher environmental impacts, while the resulting reduction in carbon footprint might be lower than expected.
"Or it might have an effect on a neighbouring country that affects your country too," he adds.
“You can influence electricity production in your own country, but it may have important ramifications elsewhere”.
With the EUREAPA tool, planners and policy makers can try out the idea, and see how it works.
Meeting environmental goals
Weinzettel’s supervisor, Edgar Hertwich, who is director of the Industrial Ecology Program at NTNU, says the tool has its origins in trying to clarify the best choice in situations where there is a conflict in environmental objectives.
Think of it as kind of like trying to find the answer to the paper or plastic question when it comes to deciding which kind of grocery bag to choose. Except in this case, the questions are on a much larger scale, and the individuals that are deciding may be making the decision on behalf of a municipality, a county or even a country.
Another important aspect of a calculator like EUREAPA is that it gives policy makers a chance to keep track of the effects of different policy decisions they have made, and in doing so, to make sure that what they are doing will get them to where they want to be.
“You need to trace environmental impacts to see if you are going to meet environmental goals,” Hertwich says.
“If you don’t have a way to track things, you don’t know what is going on.”
The details
So just what’s in the EUREAPA model? Weinzettel says there are 57 economic sectors represented in the model for 45 regions around the globe. The economic sectors include items such as agriculture and manufacturing as well as transport, recreation, health and financial services.
The tool also allows you to look at the entire impact of one country, or at a per person impact, which lets you see if the numbers that are illustrated are due to high consumption per person, or if they are due to the sheer number of citizens of the country.
China is a good example of this: for some impacts – say carbon footprint linked to food consumption – China overall has among the highest footprints of any nation. Yet on a per person basis, China has some of the lowest carbon emissions from food consumption of any country listed in the database.
EUREAPA thus allows the user to look at the “full supply chain impacts associated with the food people eat, the clothes they buy, the products they consume or the way they travel,” the tool’s website explains, and in doing so, the user gets a picture of “the impacts of consumption activities in the context of lifestyles or national differences.”
An annual check
Hertwich says that EUREAPA could be particularly helpful at the municipality level, where many decisions are made that can add up to significant impacts in the future.
“One specific application I would really like to see is if municipalities were to implement annual footprint measures, so they actually trace their own success in reducing their footprint,” he says. “We usually say that what gets measured also gets worked on.”
That way, calculating the different environmental footprints of a municipality becomes another kind of accounting that helps policymakers decide if what they are doing is working.
“If you don’t measure your environmental indicators, you will not be able to reduce your footprints,” Hertwich says.
“But if you do measure them, and do trace them, it becomes part of the standard accounting and will be paid more attention to in decision making.”


