An article from University of Tromsø – The Arctic University of Norway
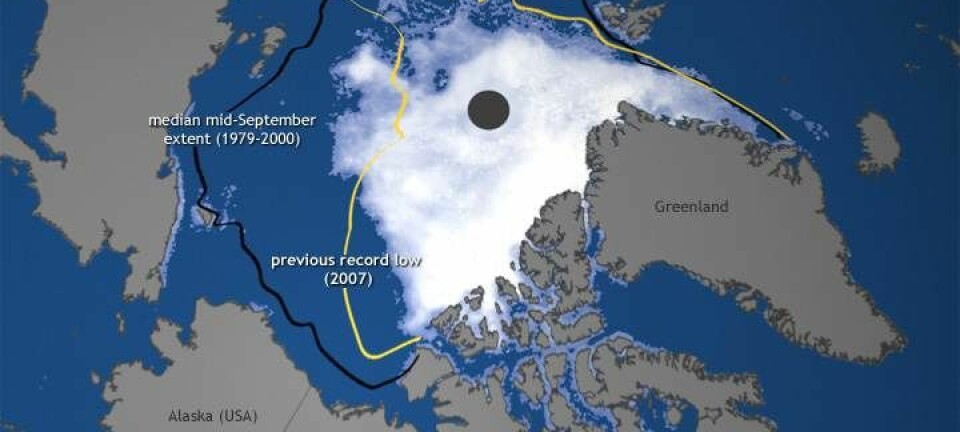
Satellites images give precise maps of the Arctic sea ice
New analytic tools give fast and exact information about ice conditions in Arctic areas.
Denne artikkelen er over ti år gammel og kan inneholde utdatert informasjon.
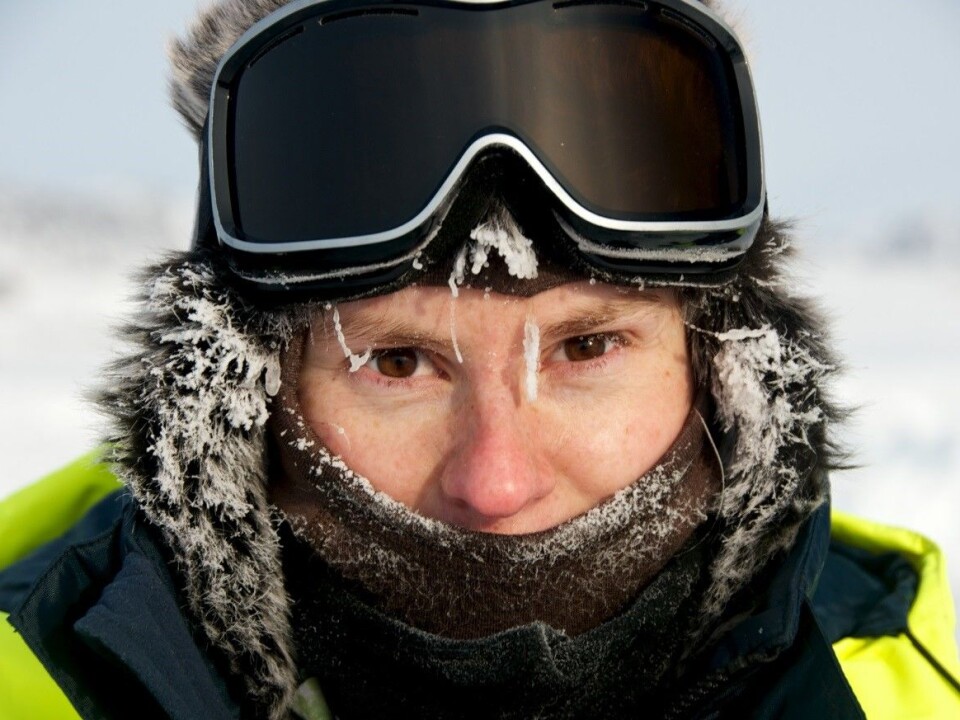
Physicist Mari-Ann Moen has developed a new method to map and describe sea ice. Her research is relevant for climate monitoring.
Precise and updated ice charts are also important for fishing boats, shipping and for rescue operations in the polar seas. Also, these maps are of interest to the oil industry and other installations in the Barents sea.
Today, new ice charts are made five times per week by the Meteorological Institute of Norway. Maps are drawn manually by experienced meteorologists who rely mainly on radar images obtained from satellites. Every year thousands of satellite images are analyzed.
"This is a very time-consuming process, and gives room for subjective assessments," says Moen.
"We have attempted to develop a method for automated analysis of radar images from the satellite, using a computer program to describe the sea ice," explains Moen.
Will distinguish compact ice from surface slush
The computer program can distinguish between different types of ice, and determine for example whether there are compact and massive ice, a lot of layered packing, areas with so-called pressure ridges where the ice is pushed up in mountain-like formations, or slush-like soup that lies on the sea surface.
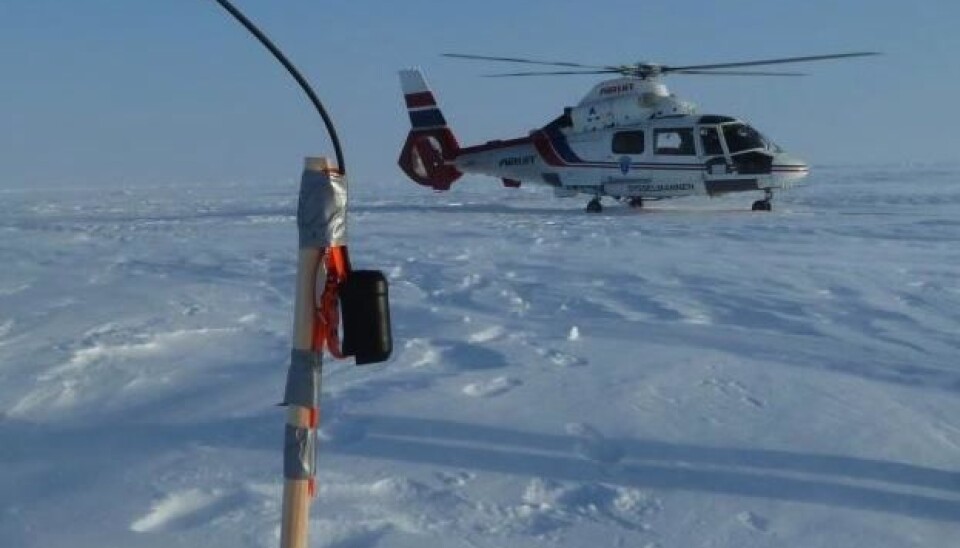
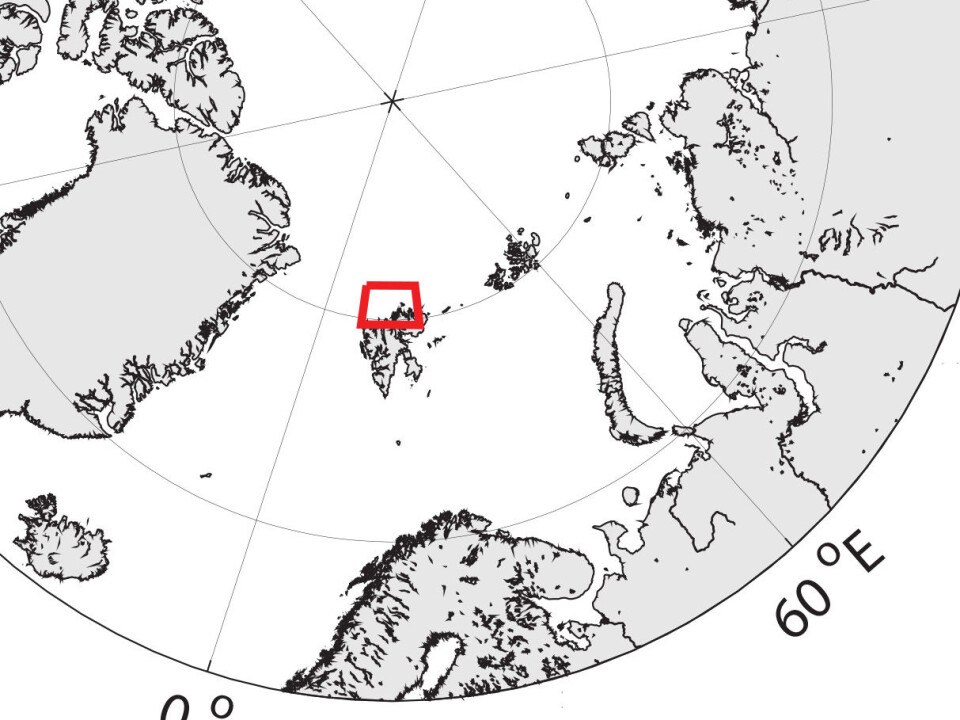
Moen analysed sea ice images obtained from satellite, boat and helicopter out in the Polar sea north of Svalbard. Moen went to sea with the coast guard ship KV Svalbard, from where she measured the ice's salt content and snow depth on the ice. To measure the ice thickness, the researcher used an instrument hanging from the helicopter.
She focused on a geographic area of approximately 25 km x 25 km, where she collected both satellite and ground data during one week in April.
Radarsat 2, a Canadian satellite, takes radar images of the Earth's surface, which are made available to researchers. Moen used radar images from different angles in order to detect different properties in the sea ice.
To complete the radar measurements, she performed ground measurements of the ice in the same area that the satellite data was taken. Salinity, moisture in the ice, thickness and packing are examples of the properties that researcher wanted to build into her analyses.
"Our objective is to contribute to the development of robust and reliable automated calculations for the description of sea ice, and through this, contribute to the effective production of ice charts," says Moen.
Translated by: Stephanie Hansen