An article from Norwegian SciTech News at NTNU
Putting pain on the map
Cancer patients can now show doctors the location of their pain with a simple touch on a tablet device.
Denne artikkelen er over ti år gammel og kan inneholde utdatert informasjon.
An electronic pain map for the iPad is a new pain assessment tool developed by a research group at the European Palliative Care Research Centre (PRC) at the Norwegian University of Science and Technology.
Patients can use the map to register the location of their pain, as well as its extent and strength. The information can then be sent electronically to the treating physician and to the patient’s medical record.
Ellen A.A Jaatun, a PhD candidate who is currently conducting her doctoral research on pain maps for cancer patients explains that the use of the device allows patients to give their doctors accurate information about their discomfort.
“This gives the doctor the opportunity to give more accurate treatment,” she says. “The pain maps are used along with verbal communication between the patient and the doctor.”
Hard to explain
Seventy to 90 per cent of all cancer patients have pain, and patients with severe pain experience a reduced quality of life. Good pain treatment makes a great difference. But first, doctors need to identify and understand their patients’ pain.
“There can be many different cancer symptoms that can be difficult to distinguish between. That means we never deal with just one aspect of the disease,” Jaatun says. “The pain, however, is often the most prominent problem for cancer patients and is consequently the most important thing to identify.”
Patients may find it difficult to describe both the strength and location of their pain-- whether in written or oral communication.
In particular, pain can be difficult to describe, especially since the patient may not be feeling the pain – or its exact strength or location – during the doctor’s examination. This lack of precision makes it difficult for the doctor to provide optimal pain treatment.
Strength, location and type of pain
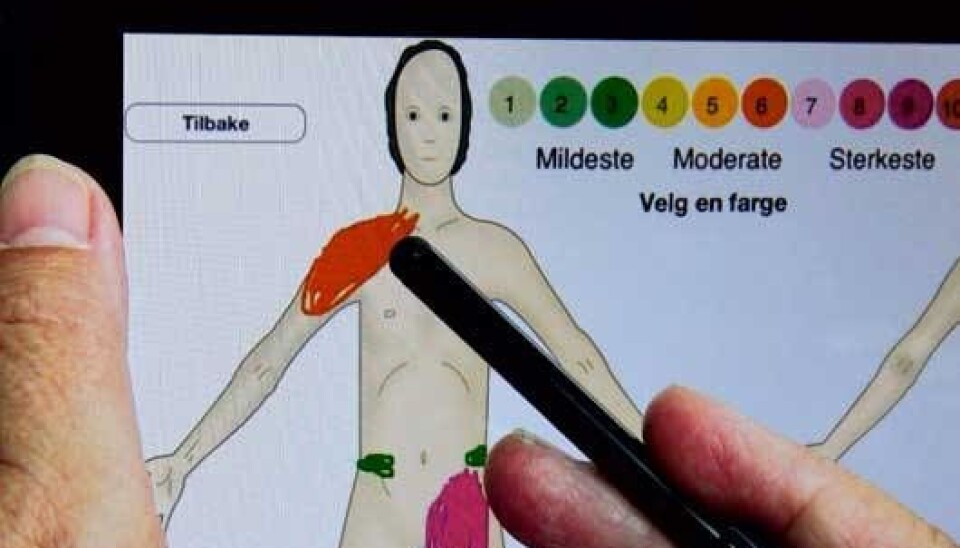
The iPad pain map app is composed of an illustration of a human full figure, seen from the front and from behind. The patient can draw the pain on the human figure using colours and numbers. The scale ranges from 0-10 and also includes colours as a visual aid: 0/green represents the lowest degree of pain, while 5/yellow represents medium pain, and 10/red represents the maximum. The pain map can also be used in multiple languages.
The map provides the basis for selecting treatments. Jaatun says that patients who register pain using the app will be treated. Patients who say their pain ranks at 7 and above will be considered as patients who need immediate help.
“Changes are more noticeable when the patient individually reports pain. If the patient registers 5 on the pain scale and then changes the pain to 1 or 2, the doctor will know that the pain treatment is having the desired effect,” she says.
“An increase from 3 to 5 tells the doctor the pain is getting worse. This may be directly due to the illness, but it can also be related to side effects of earlier treatment, or other more harmless factors,” she adds. “It is important to determine what is causing the changes in the patient’s pain level - as well ensuring that the pain is alleviated.”
Satisfied patients
The iPad pain map has been tested on 32 cancer patients since May 2012.
“The majority of users say that it enables them to convey information about their pain in a better way, and that they feel that they are also being taken more seriously,” Jaatun says.
She says it is important to remember that many of these patients have been very sick, which means that using the touch function of the iPad can be much easier than trying to coordinate a mouse with a computer monitor.
The use of an electronic tool also has several logistical and administrative advantages in a technologically developed society like Norway.
Flexible and customized
The Norwegian Health Care Administration would like doctors to prescribe more outpatient treatments and fewer overnight stays in hospitals. This requires increased flexibility among patients and hospitals.
“We must have standardized methods of recording pain when treatment and follow-up take place both in and outside of the hospital,” says Professor Stein Kaasa, who is chair of the European Palliative Care Research Centre, which is based at NTNU.
Jaatun and Kaasa believe that electronic pain maps, along with the registration of other ailments, will help with this. Meanwhile, the pain map is flexible and adapted to each patient’s individual needs, so that patients can tell their doctor about their pain whenever they like.
The way forward
Although the technology for the pain map is well developed, there are a number of other issues that must be addressed. For instance, the storage of personal information is governed by strict legislation, and the research group is now working on developing protections for privacy so that the pain map can be used at all levels of the health care service.
The research group has already invested many years of effort on the development of electronic pain map with its international partners.
The goal is improved patient participation in treatment and more personalized treatment for each patient. The researchers are also developing other assessment tools for the optimal treatment of cancer patient symptoms
“We have enough information and knowledge to say that that electronic assessment tools are very useful for cancer patients, especially the electronic pain map,” says Jaatun.
A large-scale test of the iPad-based pain map will be tested at a hospital-based cancer clinic in Edinburgh from the autumn of 2012 to the spring of 2013.
-----------------------------
Read the Norwegian version of this article at forskning.no
Translated by: Nancy Bazilchuk