THIS CONTENT IS BROUGHT TO YOU BY NINA - Norwegian Institute for Nature Research - read more
Documenting nature loss in Norway with eyes from the sky and AI
The Norwegian Broadcasting Corporation NRK enlisted the help of researchers to shed light on a dark reality: While Norwegian nature is being lost bit-fot-bit, no one is watching.
The investigative journalism recently published by Norwegian Broadcasting Corporation NRK has left many shocked. Norway has, on average, lost at least 79 square metres of nature per minute over the past five years.
That is a total of 207 square kilometres. The story behind the numbers is also intriguing.
No oversight from the authorities
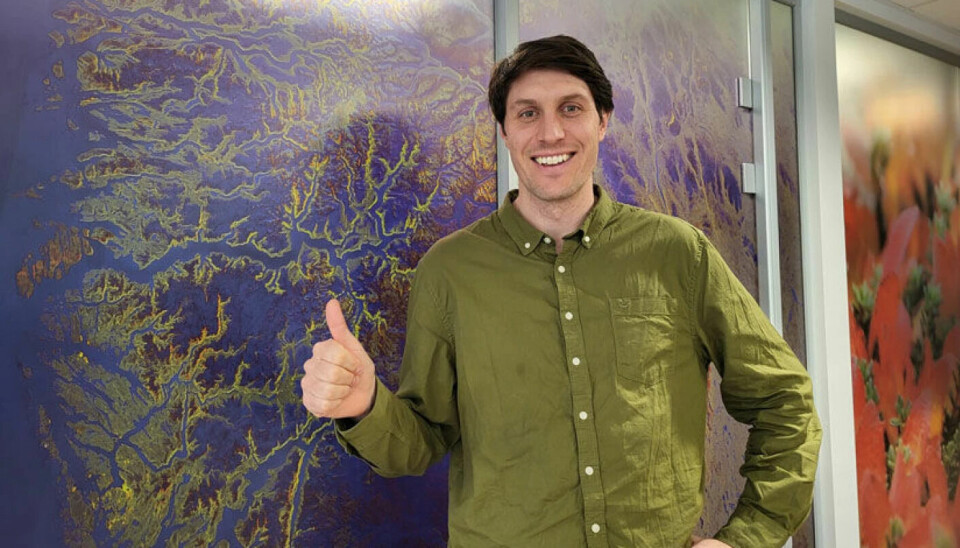
During 2022, Zander Venter, a geospatial scientist at the Norwegian Institute for Nature Research (NINA), was contacted by Mads Nyborg Støstad. Støstad is a journalist and expert in digital storytelling. His simple question was: Do we have data showing us how much nature our society consumes in Norway?
The journalist had asked Statistics Norway, the Norwegian Institute of Bioeconomy Research (NIBIO), and the Norwegian Environment Agency.
None could give him a straightforward answer.
As Støstad points out in the NRK article, he was both surprised and concerned that the authorities have no oversight of nature loss.
Venter had recently published a paper reviewing state-of-the-art satellite-based maps of land use. It was coincidental that he was in the process of incorporating the maps into NINA’s projects on ecosystem accounting when Støstad contacted him.
He was able to produce a map of nature loss in Norway between 2017 and 2022.
NINA uses eyes from the sky and AI
Venter used Google’s dataset called Dynamic World. It uses publicly available images from the two satellites Sentinel-2A and Sentinel-2B. They are operated by the European Space Agency.
These satellites continuously orbit the globe and take pictures of the entire world, including Norway, with a resolution of 10 metres.
The images are quite blurry, but Google uses artificial intelligence (AI) to analyse such satellite images and recognise different types of land use.
AI can recognise nine different categories: water, trees, grass, flooded vegetation, snow and ice, shrub and scrub, bare ground, crops, and a final category calledbuilt area.
Zander used the raw outputs from the AI model to uncover whether natural areas have been developed.
More specifically, the AI gives a probability for each data point - or pixel - of 10 x 10 metres on the map of Norway being developed or not. Using time series analysis, Venter could identify pixels, and ultimately patches of pixels, that went from natural to developed coverage.
Journalists acting as researchers
AI models are biased and not without error. Unfortunately, many who use AI products forget to account for this before drawing conclusions.
"I asked the journalists if they were willing to follow scientific methods and quantify effors in the map and calculate uncertainty. They said yes," Venter says.
NINA has several ongoing projects on ecosystem accounting, which are piloting methods for quantifying uncertainty in maps of ecosystem extent, condition, and services.
Venter therefore had the statistical tools to guide the journalists through the process of checking the maps and calculating uncertainty.
It went down like this: Venter sent them thousands of random locations to verify if nature loss had in fact occurred or not.
Using services such as norgeskart.no, Norge i bilder, and Google Earth Pro, they verified each and every point and sent the data back to Venter.
The researcher then ran the data through a statistical model. He calculated that the margin of error was 18 per cent. In other words, AI was wrong in just under one out of five times when a pixel was flagged as nature loss. Venter accounted for the error when calculating the built areas in Norway.
The journalists went on to use many other datasets which NINA has helped produce to explore what types of nature we are destroying in Norway. For example, Vegar Bakkestuen, another NINA researcher, had also used AI and remote sensing to map wetlands over southern Norway.
The journalists used this to explore how much peatland has been lost. Peatland is an important ecosystem for both carbon storage and biodiversity.
A vision for the future
Venter notes that it is important to remember that they only calculated how often AI incorrectly identifies nature loss. They did not calculate how often it overlooks nature loss, so-called false-negatives. Doing so would require more manual work.
"This means that our calculations are minimum figures, and that the real nature loss is greater," Venter says.
Due to the coarse resolution of the satellite images, the researchers also know that they cannot detect smaller areas of nature loss. This could be caused by, for example, forestry roads, access roads to wind turbines, and small buildings like cabins.
"We have also not mapped other forms of nature loss, such as logging, cropland expansion, and all the subtle impacts humans have on nature through sound, light, and chemical pollution," Venter says.
But even though nature continues to be lost – bit by bit – Venter sees hope for the future.
Reference:
Bakkestuen et al. Delineation of Wetland Areas in South Norway from Sentinel-2 Imagery and LiDAR Using TensorFlow, U-Net, and Google Earth Engine, Remote Sensing, vol. 15, 2023. DOI: 10.3390/rs15051203

This content is paid for and presented by NINA - Norwegian Institute for Nature Research
This content is created by NINA's communication staff, who use this platform to communicate science and share results from research with the public. NINA is one of more than 80 owners of ScienceNorway.no. Read more here.
More content from NINA:
-
How will climate change affect lakes worldwide?
-
White-tailed sea eagles are breeding in Ireland again after more than a century
-
Could a tunnel help wild reindeer in Norway?
-
Norwegian white-tailed sea eagles are helping to rebuild a lost population in Ireland
-
1 in 4 freshwater species are at risk of extinction: "It's not too late to take action"
-
Insects prefer cold winters with lots of snow


