An article from Norwegian SciTech News at NTNU
The Viking’s grave and the sunken ship
See a Viking’s grave or travel to the ocean floor. New technology allows archaeologists to easily map excavation sites in 3D.
Denne artikkelen er over ti år gammel og kan inneholde utdatert informasjon.
Mapping archaeological digs takes plenty of time and a lot of measuring, photographing, drawing and note taking. Now, most of this work can be done with a technique called photogrammetry.
Photogrammetry is a method that uses two dimensional images of an archaeological find to construct a 3D model.
You don’t need and special glasses or advanced equipment to use make use of this new technique. Together with precise measurements of the excavation, photogrammetry can create a complete detailed map of an archaeological excavation site.
“This is still a very new technique,” say archaeologists Raymond Sauvage and Fredrik Skoglund of NTNU University Museum.
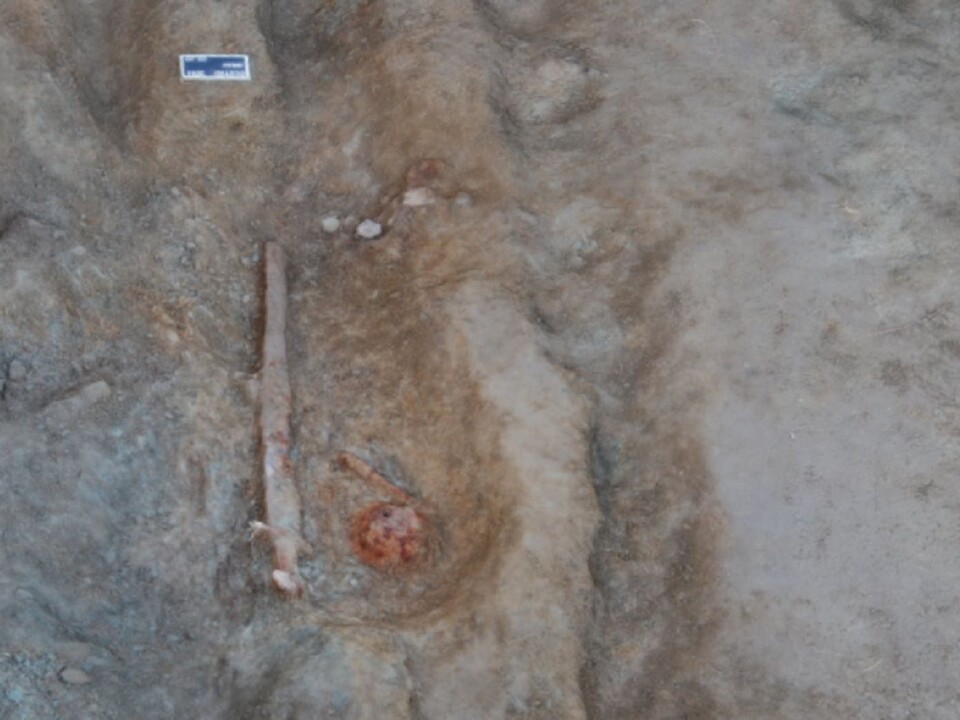
Photogrammetry is in many ways much more precise than older, more time-consuming methods.
Viking graves
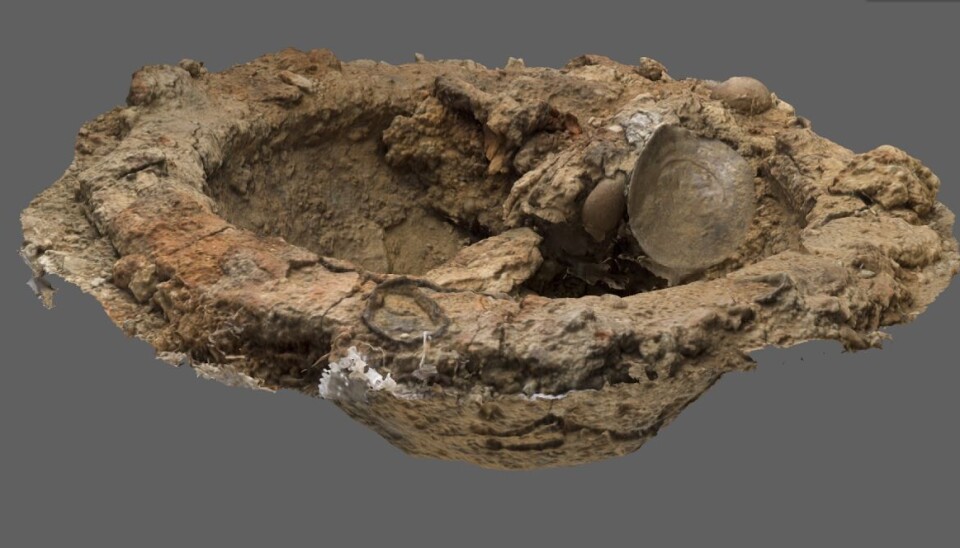
This method is already being put to use by archaeologists. When a possible Viking grave was found in Skaun in Sør-Trøndelag in 2014, the excavation site was mapped using photogrammetry.
The manner in which artefacts are found, how deeply the are buried and where they are placed in relation to each other can provide a lot of information to archaeologists studying a site.
Photogrammetry also makes it easier for archaeologists to share their findings with others. The 3D models that are produced can be saved as normal PDF files, which you can send to colleagues for input.
If you have a powerful enough laptop, you can go in and see an example of a Viking archaeological site here. This is a lower-quality version, but you still get a good impression of how the model works. You can zoom, change angle and rotate. A PDF of a Viking’s shield boss can be found here.
Saving time
The two archaeologists are very enthusiastic. A Russian company has developed the program that they’re using at the museum. The program is easy to use and gives good results. The development and use of the technique has exploded in recent years.
“There’s a lot more interest in photogrammetry now. The new program is readily available and inexpensive,” says Sauvage.
He explains that it provides the kind of quality and detail that you could only dream of a few years ago. Even though the method requires some work, it still saves a lot of time.
“In one day, you can get three million measurement points. Before, we were satisfied with 3000,” he says.
And those 3000 points could take a long time to find. This method can save archaeologists weeks of work with tape measures, sketching paper and cameras. The practical work in the field goes much quicker.
“This frees up a lot more time for things like research,” Skoglund says.
Old finds
Similar results have been achieved in the past using laser equipment and early versions of a photogrammetry program. But this has been very expensive, and takes a lot of time and resources.
The new program only costs a few thousand kroner, meaning that it is much more widely available.
With a photogrammetry program, three or four pictures from different angles are enough to make a simple 3D model, although more images will provide a higher quality model. You can use any normal camera.
“The more images, the better the quality,” Sauvage says.
It is also possible to use images of old finds and build a 3D model based on them. For example, you could make a model using photos from previous excavations of Viking graves, and use this to explore how an excavation site changes over time.
Shipwreck
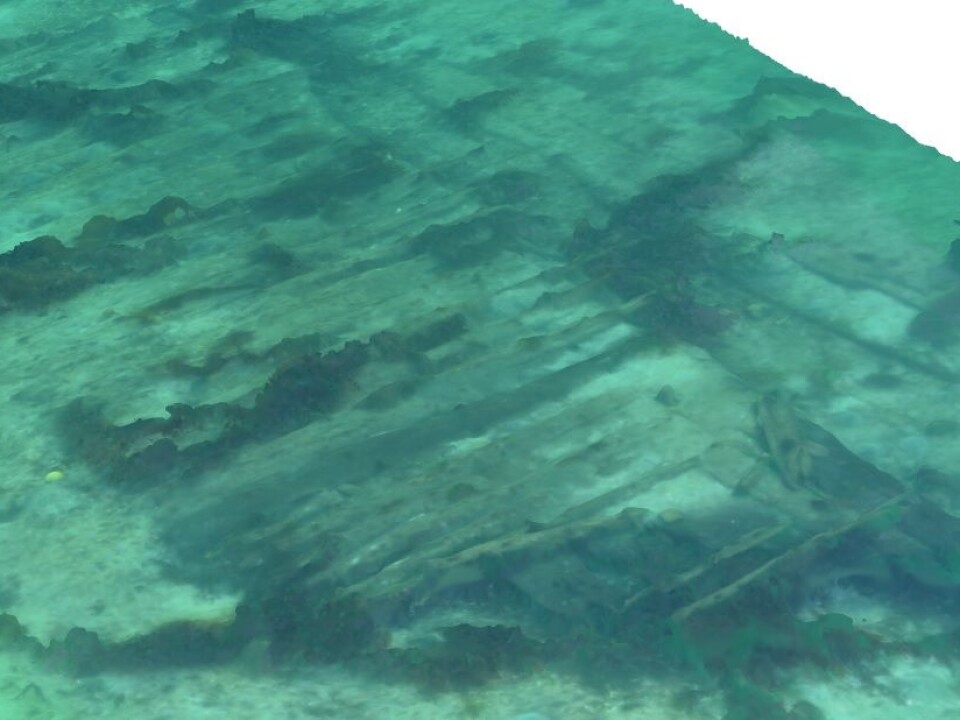
Marine archaeologist Skoglund has tried this with the Dutch ship “De Grawe Adler” (the Grey Eagle), which sank in 1696 by Strømsholmen in Hustadvika, and was discovered in 1982 when dredging for sand destroyed parts of the ship.
“I swam along the whole length of the wreck a few years ago and took pictures,” Skoglund says.
He did so with out ever considering the possibility of making a 3D model of the wreck. The fact that the photos were taken underwater makes it slightly harder to put them together, but it is by no means impossible. You can view a model of “De Grawe Adler” here.
If the results are precise enough, they can be used to monitor the decomposition of the ship. Finds under water tend to be particularly fragile, but decomposition can be difficult to see. You can’t just dive down every few years to make sure that everything is OK. With this new method, the decomposition can be measured much more precisely, and appropriate protection measures can be put in place.
The future
The next step is likely to be able to put on a pair of 3D-glasses and virtually walk into an excavation site, although that may be a few years in coming.
There is one challenge, however — storing measurements digitally in a manner that will be useful for generations to come. Archaeologists working today are behind measurements and notes on excavations that may be used hundreds of years in the future.
A paper photo taken 100 years ago is just as good now as it was then, as long as you have it on hand. But nobody knows if a PDF file will be of use in year 2115. But this is a challenge facing all information that is stored digitally. And it’s something that we can’t overcome.


