Space radars see pirate loggers
Loggers can get away with felling single trees here and there in rain forests, you might think. Not so – they can be caught by radars in space.
Denne artikkelen er over ti år gammel og kan inneholde utdatert informasjon.
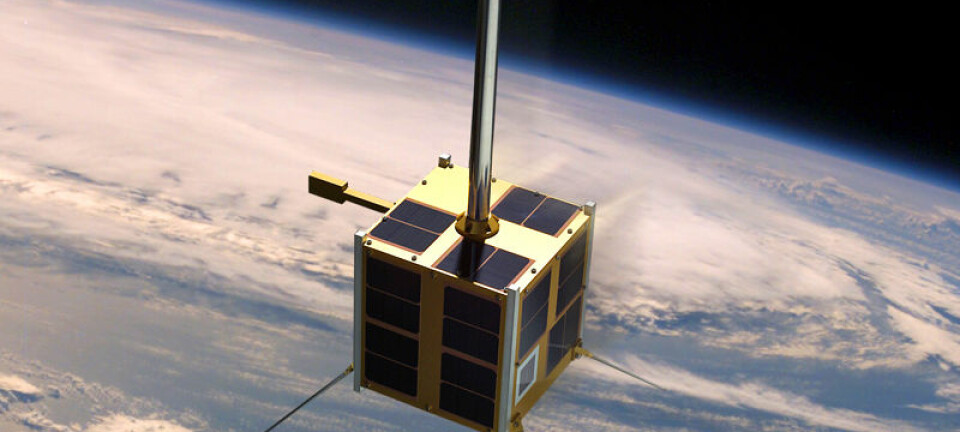
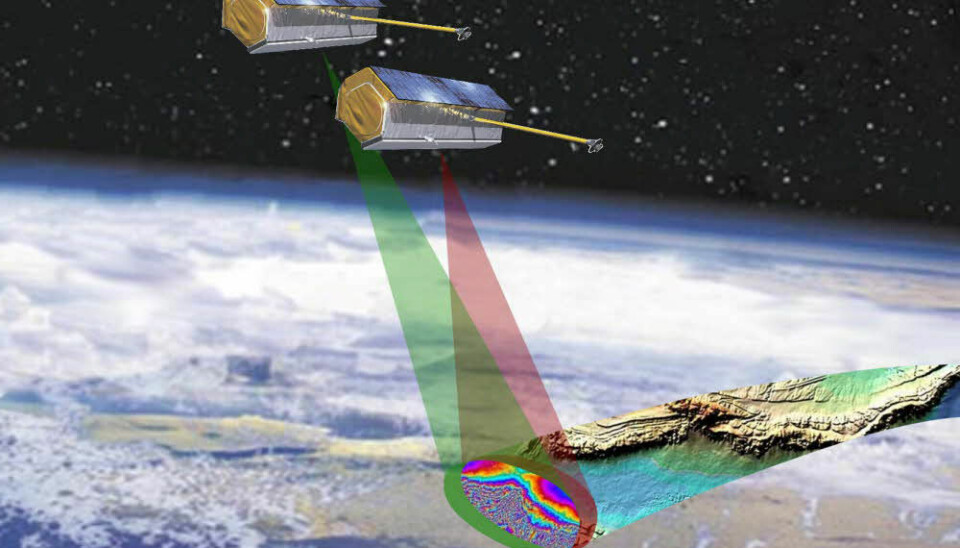
Two German satellites orbit in formation in the twilight above the Earth, just a few hundred metres apart. TerraSAR-X and TanDEM-X can travel from the North to the South Pole in 47 minutes.
TanDEM-X sends radar pulses down to Earth. The radar waves echo back. The satellites have antennas to pick up the radar echoes.
And two satellites see better than one. Scientists can compare how the two radar eyes see the echo. Just as our eyes give us depth perception, the two radar eyes on these satellites provide the best topographical maps ever made of the planet.
Topographical maps have numerous uses: navigation, geology, flood control, monitoring of seas and glaciers – and protection of forests.
Pirate timber operations revealed

Professor Svein Solberg of the Norwegian Forest Research Institute in Ås points to a picture on his computer screen:
“Pictures like these enable us to chart how much forest there is in a landscape. We have two projects running now, one in Norway and one in Tanzania,” he explains.
The method is perfect for a rain forest watchdog. Tropical forests can be covered in mists or hidden beneath cloudy skies but that doesn’t stop the radar.
A lot of illegal logging operations are run in the Amazon Jungle. Loggers try to camouflage their work by removing single trees rather than clear-cutting whole areas.
“This piracy can be hard to detect with traditional satellite imaging. But by comparing these sharp radar images you can see the changes,” says Solberg.
Lågen Valley as a key
The picture he displays on his screen isn’t from the Amazon, but from Lardal in the Lågen Valley, Vestfold County, Norway.
“In the municipality of Lardal we have all kinds of good data," he says. "The measurements of the field there can be used as a kind of calibration key, a true baseline we can use to compare the satellite pictures. We use it to develop and accurately adjust calculation methods."
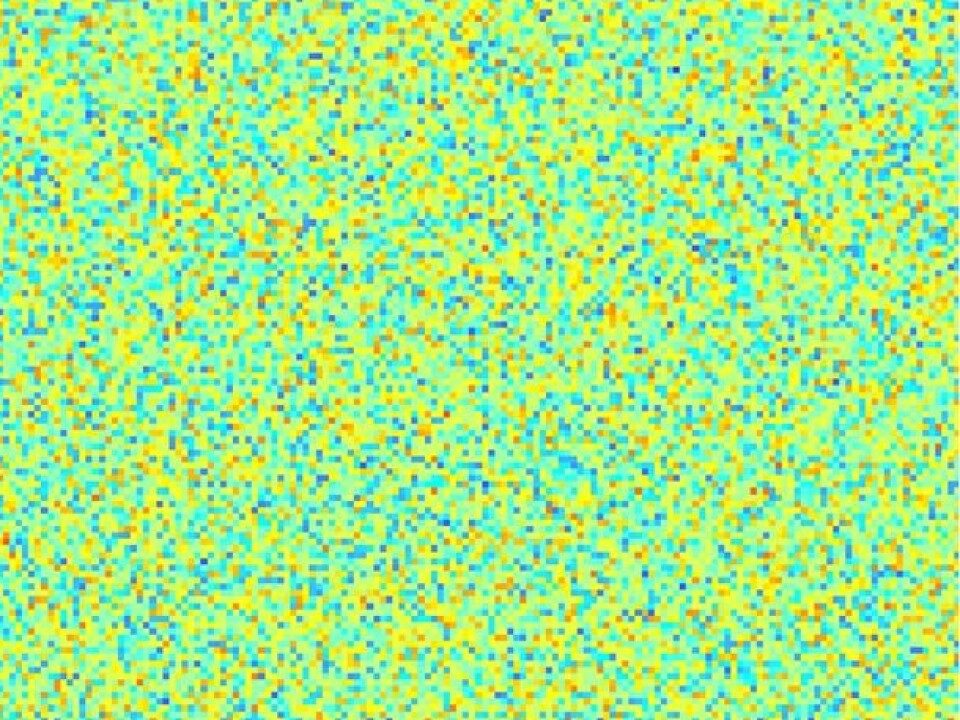
This picture doesn’t look much like Lågendalen. It consists of densely packed coloured dots.
“This is the radar data we see from the satellite,” says Solberg, while explaining step by step how the computers use hours crunching such radar data before providing meaningful pictures.
The echoes of the radar waves hit the two satellites at slightly different times. Each of the dots, or picture elements, say something about when the tops of the waves hit the antennas. This is called the phase.
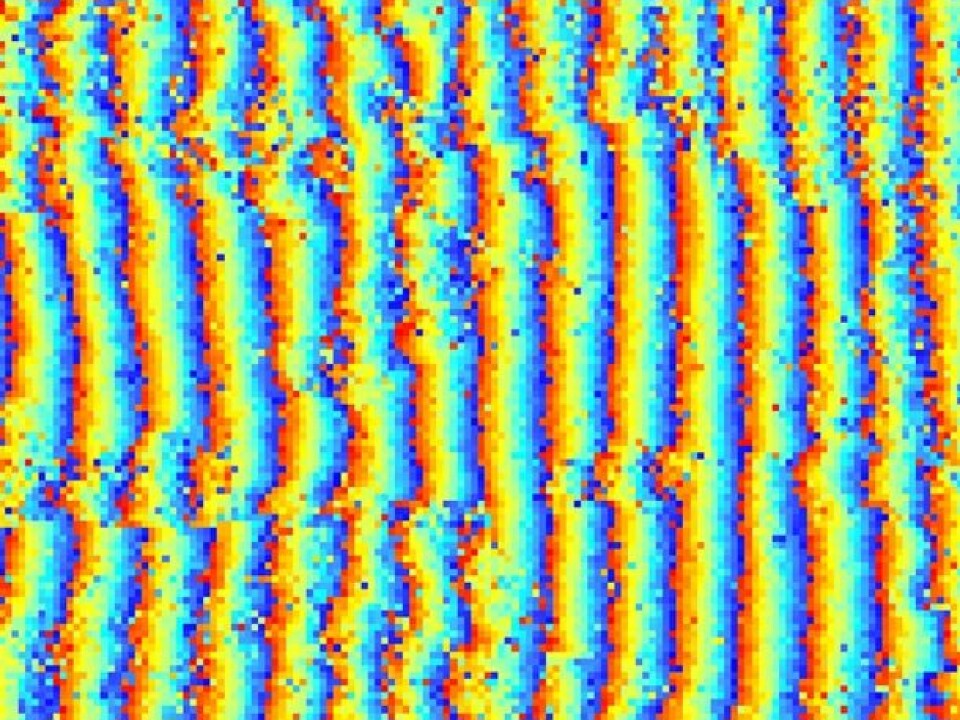
“The individual phase images look like static noise, but when they are fitted together exactly right we can calculate the time difference, or the phase difference. This gives us a pattern called an interferogram.”
From dots to stripes
This interferogram still bears little resemblance to the Lågen Valley. But Solberg can read information from the vertical rainbow stripes. They contain topographical info – not only the terrain but also the heights of trees.
“In some spots the stripes curve to the left. That means higher terrain or trees. If the stripe curves right, that’s lower terrain or trees. But we have to eliminate some of these stripes."
Not all the stripes are useful for gauging the terrain. Some are false elevation curves because the radar eyes are looking down at an angle. The more they see from the right, the more the landscape disappears in the distance.
“The computer calculates and eliminates this effect, so the elevation curves are made as if the satellites were looking straight down on the landscape,” explains Solberg.
The forest sticks up
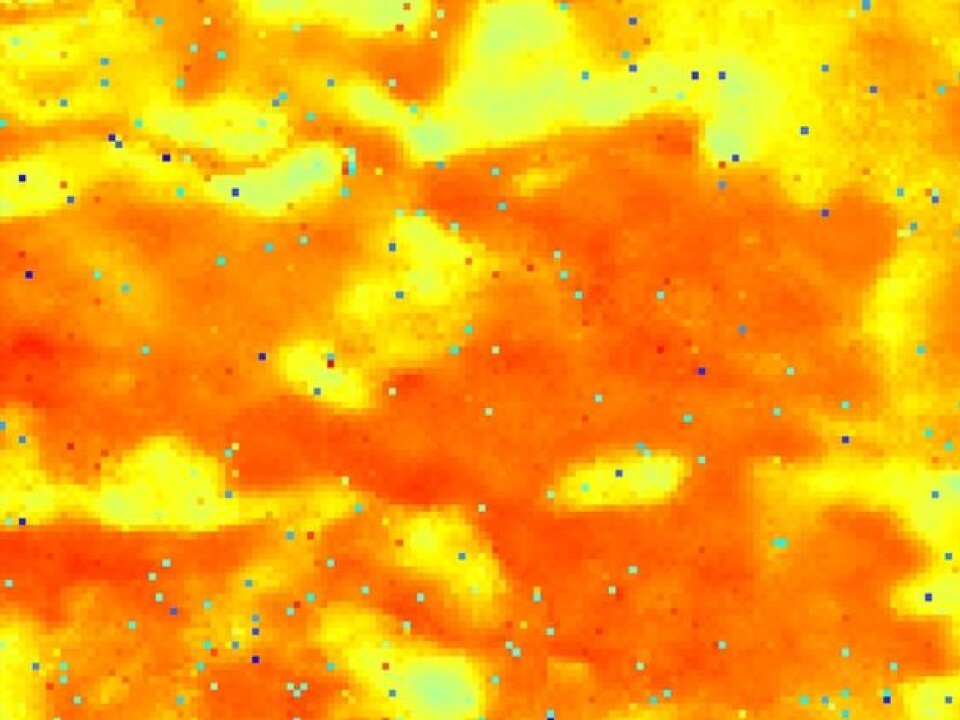
The yellow and orange picture still looks more like the Sahara than Lardal in the Lågen Valley. But Solberg isn’t done yet:
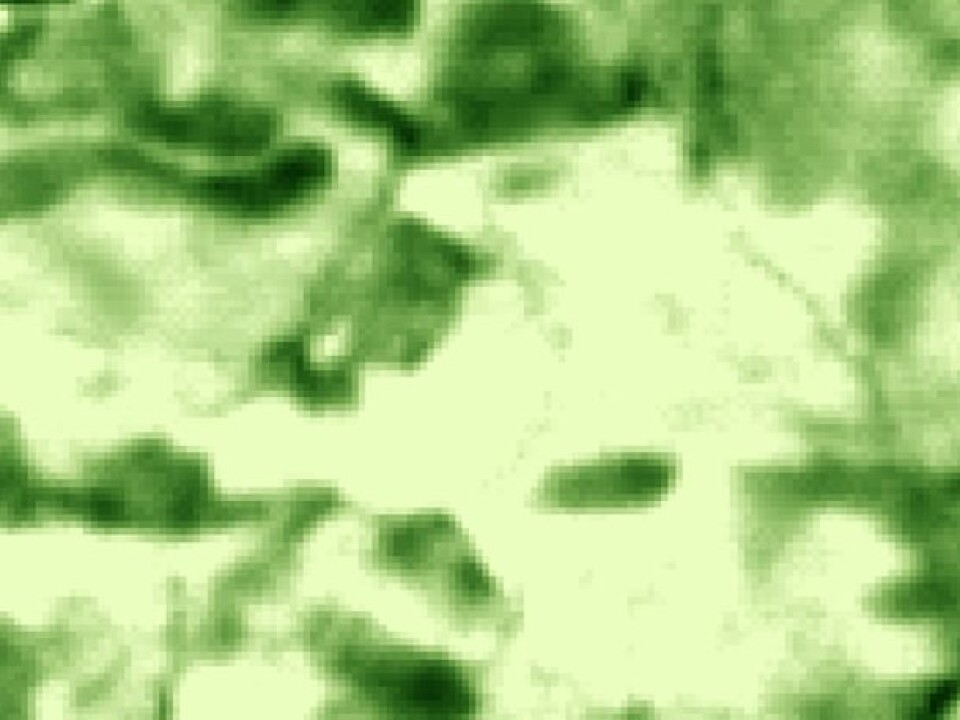
“Now we see the differences in altitude. We have to compare them to a standard topographical map. Then we can see where the trees stand in the terrain,” he says.
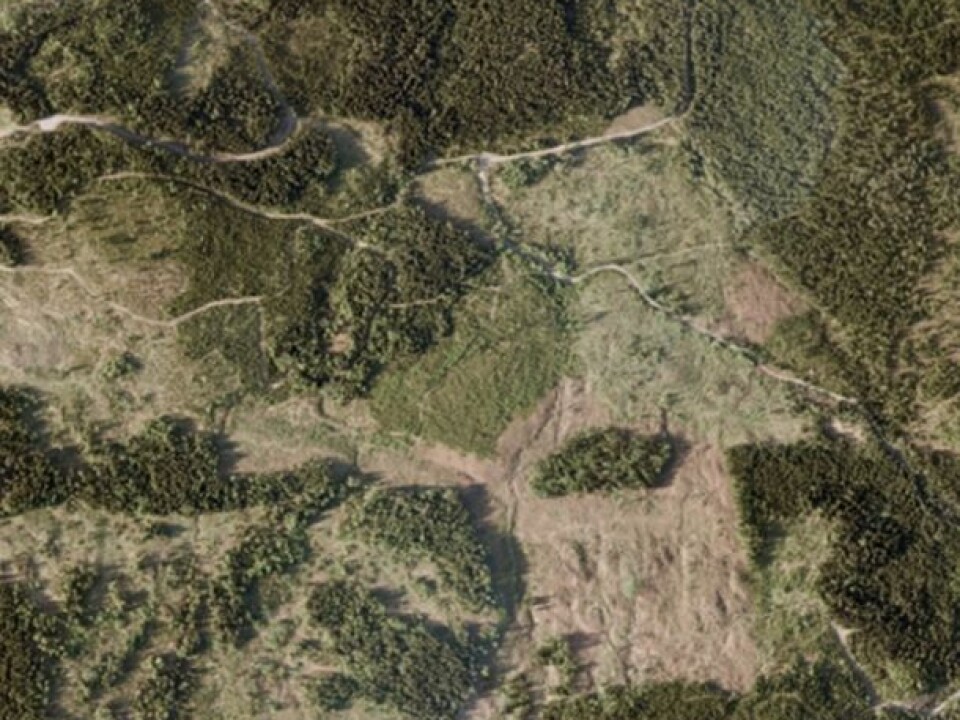
Now we’re getting somewhere; this starts to look like a logging area in Lardal Municipality in the Lågen Valley. Solberg displays an aerial photo to compare it with.
“The radar shows dark areas where the forest is. The average altitudes here are higher.”
From altitudes to quantities of forest
Solberg and his colleagues are trying to use the differences in heights to ascertain forest biomass. In other words: if you measure a certain increase in altitude, how much biomass, how much forest, does that represent?
This is far from elementary, even though the computer has solved the question. Equal differences in altitude can signify diverse amounts of forest.
“Forest with a lot of leaves gives off a completely different echo than forests without so much foliage," says the researcher. "Straight bare trunks give a different image than ones with lots of branches. Each kind of forest requires its own calculation factors.”
Changes are revealing
This phenomenon is less of a problem when it comes to illegal logging in the Amazon. There the key factor isn’t the total quantity of forest; it’s the changes in quantity that expose the lumber cutting.
Researchers need to know how the forest was previously to detect any changes. The two German satellites can’t help much on that count, as yet. They have only been in orbit since the summer of 2010.
But older data is available. In 2000 the Endeavour Space Shuttle orbited the Earth with two antennas – one fastened to a 60-metre boom.
“These recordings didn’t create radar pictures as sharp as those of TerraSAR-X and TanDEM-X, but we hope they can help provide information on how fast deforestation has been in the past 11 years,” says Solberg.
Indonesia next?
He also hopes the Norwegian Forest Research Institute can help monitor the rain forests in the mountains of Kalimantan on Borneo.
“The Indonesian Government has allocated vast sums to protect these forests from illegal logging. Observations from the ground and from TerraSAR-X and TanDEM-X will be used. We hope to participate,” says Solberg.
Translated by: Glenn Ostling
Scientific links
- Techincal information on TanDEM-X from Deutsches Zentrum für Luft- und Raumfahrt e.V.
- General information about TanDEM-X and TerraSAR-X from Deutsches Zentrum für Luft- und Raumfahrt e.V.


